Searchable.City
A searchable visual index of New York City, created by running a Vision Language Model on millions of images. To appear at SIGGRAPH 2026.
Project Details
Inspiration
Every ten years, New York City conducts a massive, manual census of its street trees. Thousands of volunteers walk every block with clipboards, counting and identifying every oak and maple across the five boroughs. They do it because the digital map does not know the trees exist.
To Google or Apple, the city is a grid of addresses and listings. The rest of the world gets flattened. Not because it is invisible, but because it was never entered into a database. The map can tell you where a pharmacy is. It cannot tell you where the fire escapes are. Where the murals are. Where the awnings begin. Where the street trees actually cast shade. Where the scaffolding still hangs. That is not a New York problem. It is a mapping problem.
Overview
Standard maps rely on rigid databases. We used a supercomputer to "watch" the city instead. By generating hundreds of tags for every street view image in New York City, we created a searchable visual index of the city.
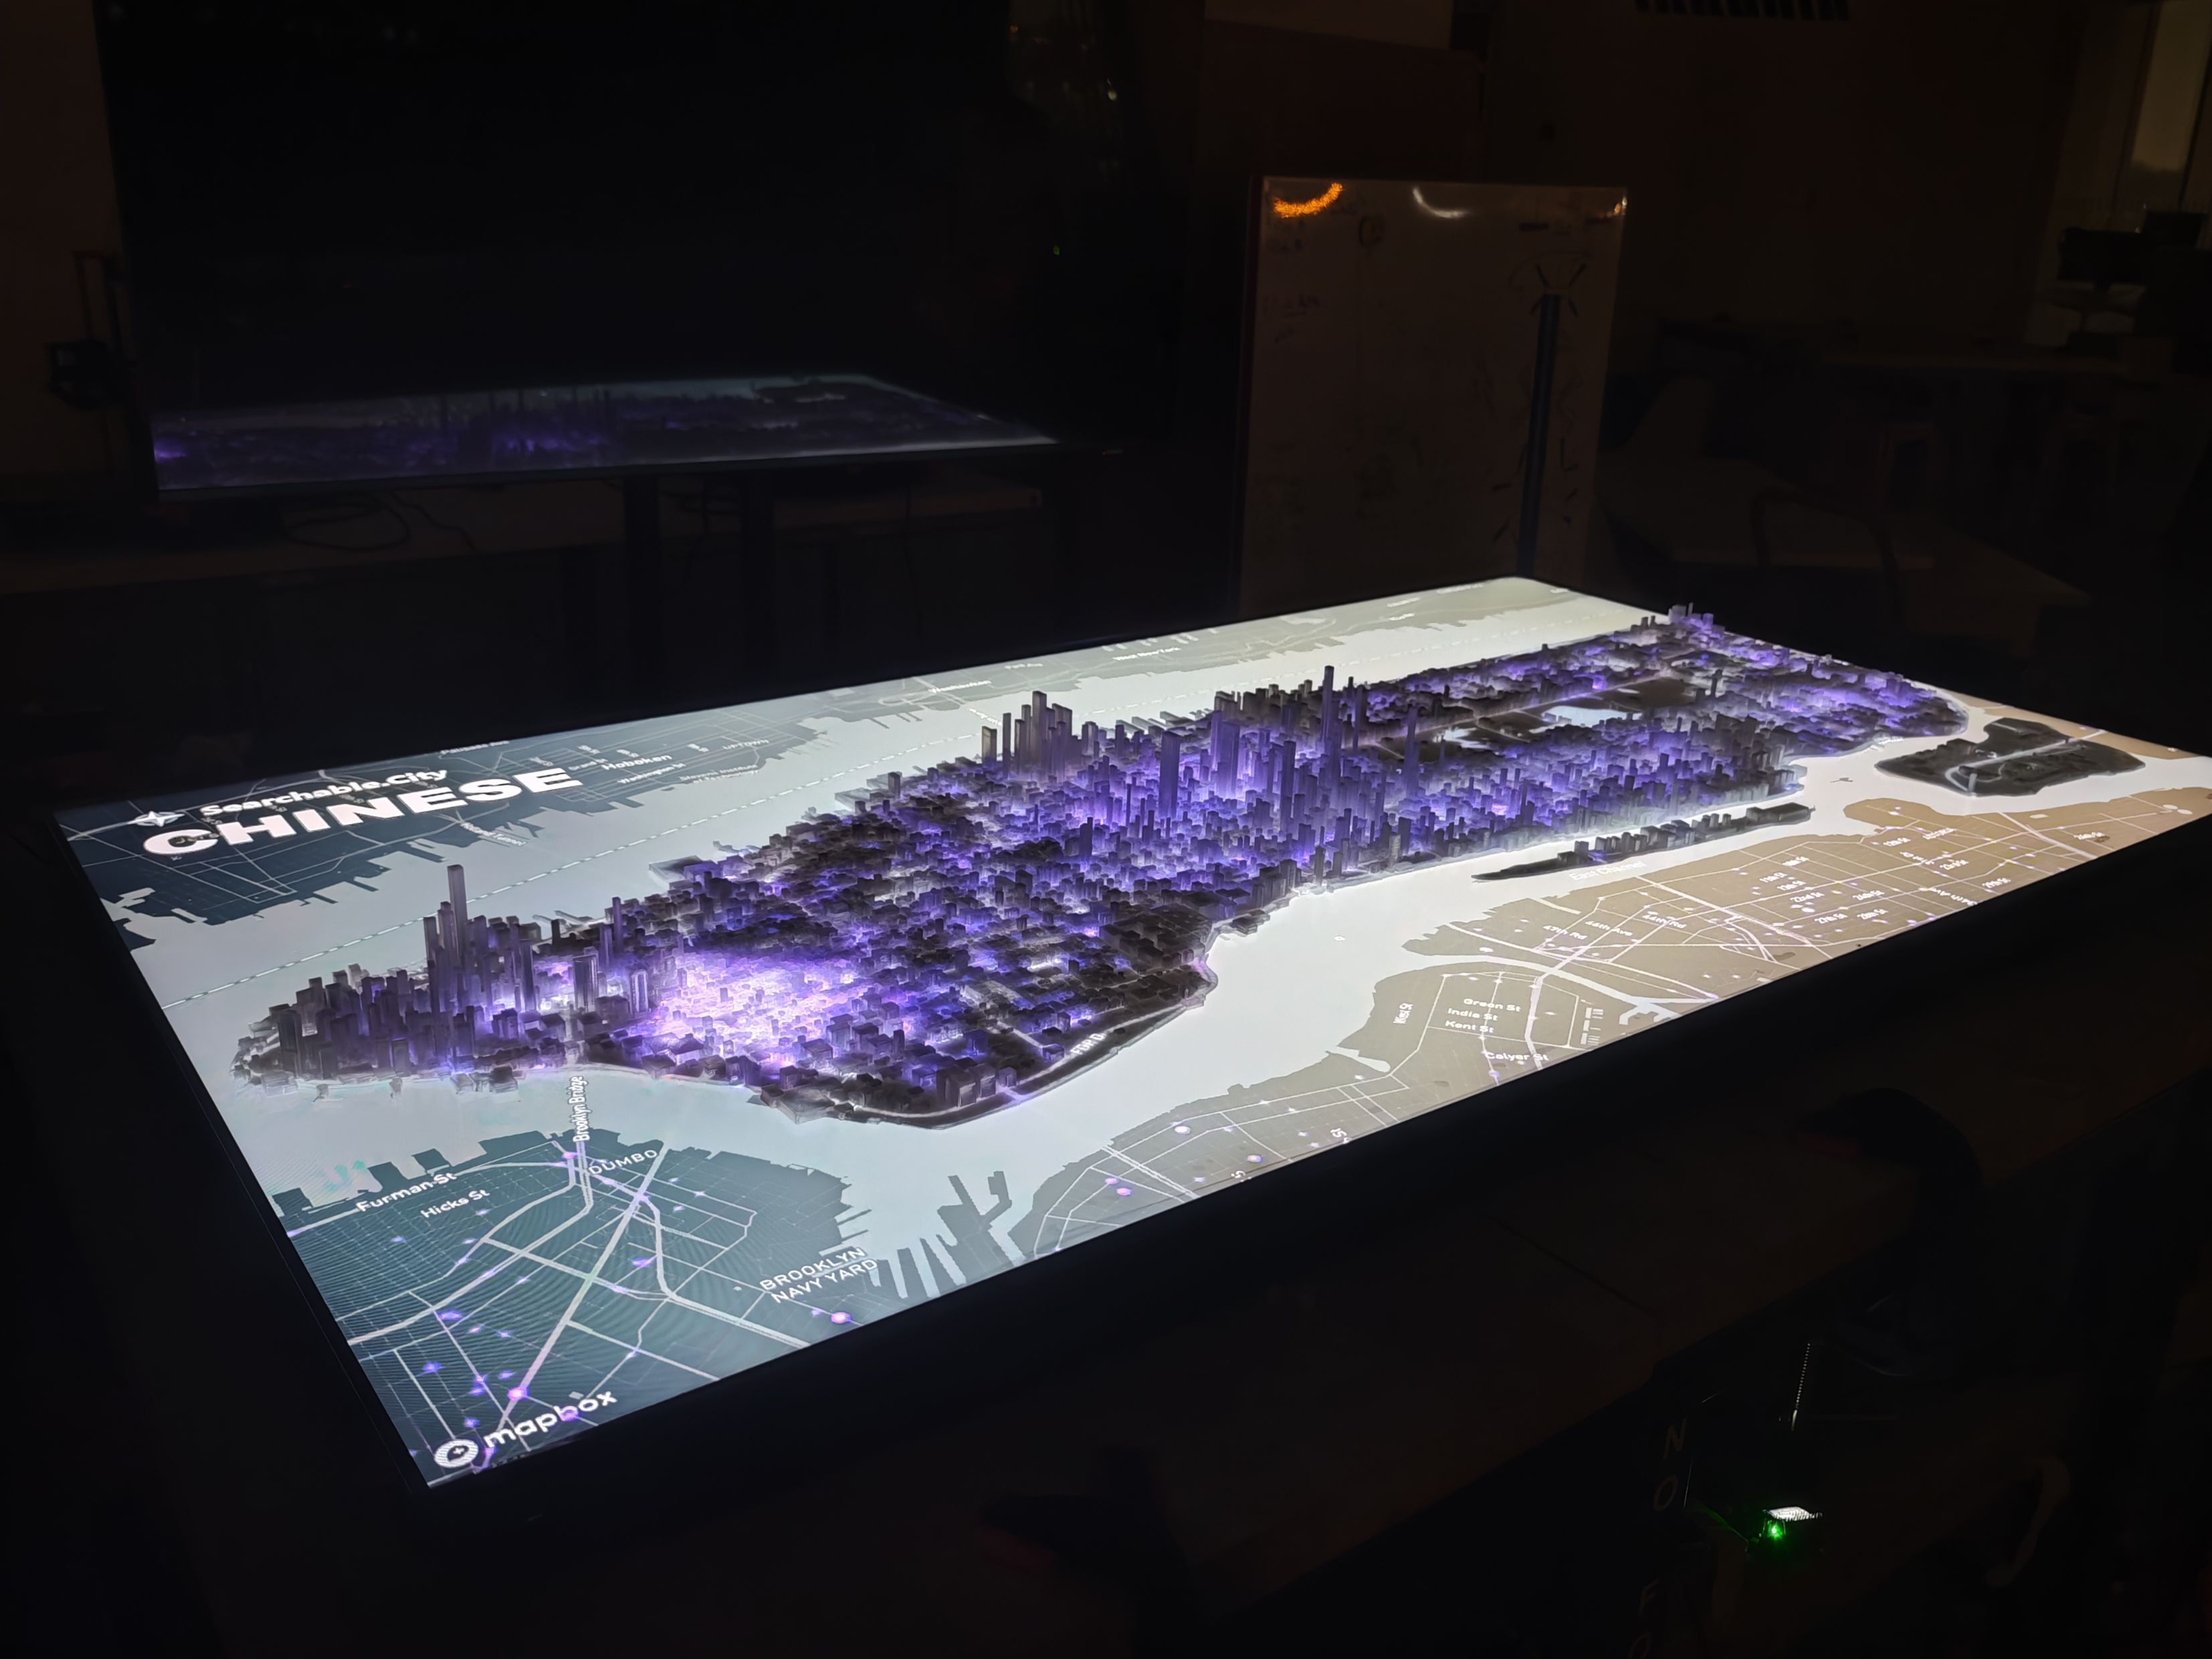
When we query "Chinese," the AI identifies architectural patterns, signage density, and color palettes. It successfully delineates Chinatown without knowing a single zip code. When we query "Gothic," it reveals the 19th-century spine of the city (churches, universities, and older civic buildings) separating the historic from the modern glass towers.
The Ghost in the Machine
This was unexpected. When we queried "East" vs "West," the model accurately lit up the respective sides of Manhattan.
|
|
|
The Decoded City
When you stop looking for addresses and start looking for patterns, the invisible becomes obvious.
|
|
|
Perpetual Construction
Mapping scaffolding is effectively a way to map change. It highlights exactly where money is being spent on renovation, and where Local Law 11 is forcing facade repairs. It is the temporary city, frozen in 2025.
The Air Conditioner
Consider the air conditioner. As modern HVAC systems retro-fit the skyline, the window unit becomes a marker of building age and socioeconomic strata. A semantic query can instantly light up every wall sleeve or hanging unit across the boroughs, revealing the city's pace of renovation in real-time.
The Visual Language
We found over 3,000 unique descriptive tags. Here are some of the weirdest correlations:
| Visualization | Query & Observation |
|---|---|
|
|
BAGELThe breakfast of champions. Note the complete absence in industrial zones. |
|
|
BEERIdentifies bars, advertisements, and bodegas with neon signage. |
|
|
GARBAGECorrelates with commercial density and foot traffic. |
|
|
GRAFFITIThe unauthorized art layer of New York City. |
|
|
FLOWERThe city's landscape punctuated by seasonal blooms. |
The Blind Spots
However, this approach has inherent limitations. It is bound by the same physics as the human eye. A fire hydrant can vanish behind a double‑parked delivery truck. A basement entrance can dissolve into darkness. A sidewalk ramp can be present, and effectively invisible, if the frame catches it at the wrong angle.
And then there are the structural blind spots: what the camera never sees. Courtyards. Lobbies. Rooftops. The private city behind the street wall. Street View is not “the city.” It is a particular pass, from a particular height, on a particular day, along routes that a platform chose to drive and update.
Unlike ground-truth datasets provided by the city, a visual index carries the biases of its vantage point. It sees what the street view car sees - no more, no less. This map represents probabilities, not absolute facts. A missing tag doesn't prove a missing object. In fact, the empty spaces on the map often reveal more about the limitations of data collection than they do about the city itself.
The Searchable Future
Imagine a city you can Ctrl+F. Not a list of addresses: a living surface you can query. Search: “scaffolding.” Search: “shade.” Search: “flood risk.” Search: “closed storefront.” Search: “stoops where people actually sit.” We’re heading toward a continuous, searchable reality. As cameras multiply and refresh cycles compress, the map stops being a document and becomes a question you can ask at any moment. The interface is simple—a search bar—but what it returns is new: a city organized by meaning instead of coordinates. This is what open-vocabulary mapping unlocks. Not just navigation, but perception at scale: the ability to see how the city changes as if you stood on every corner at once.
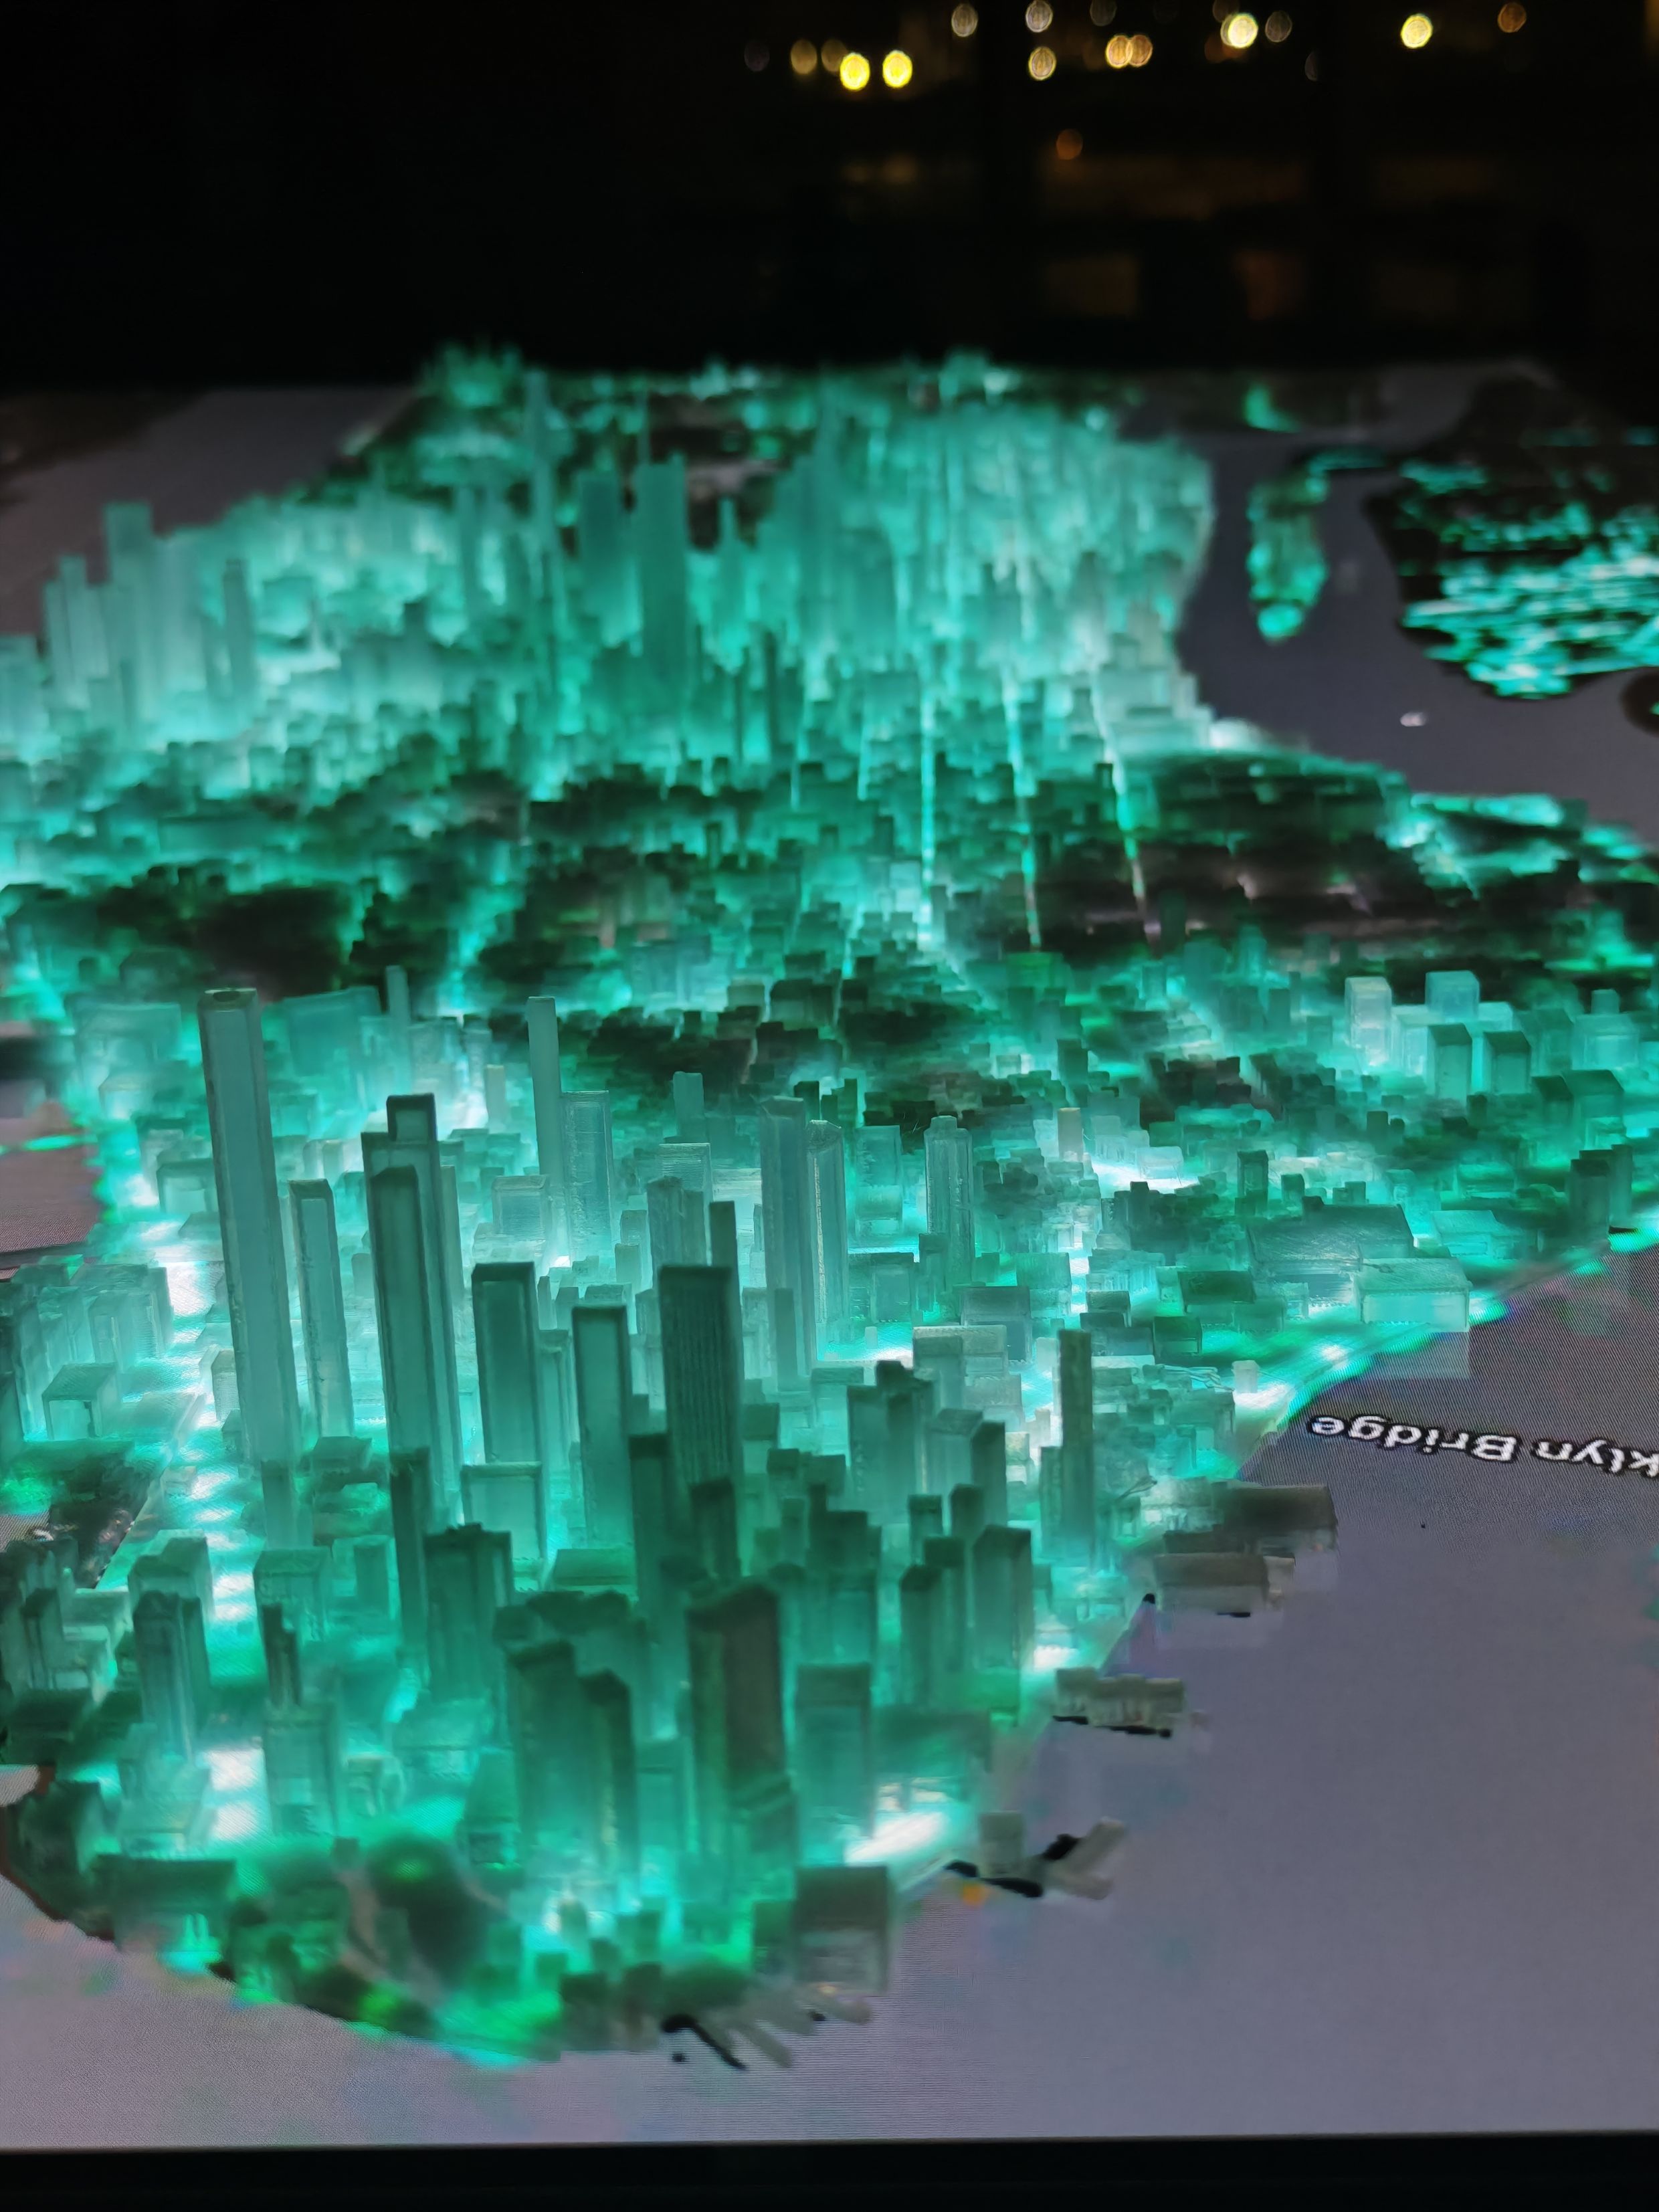
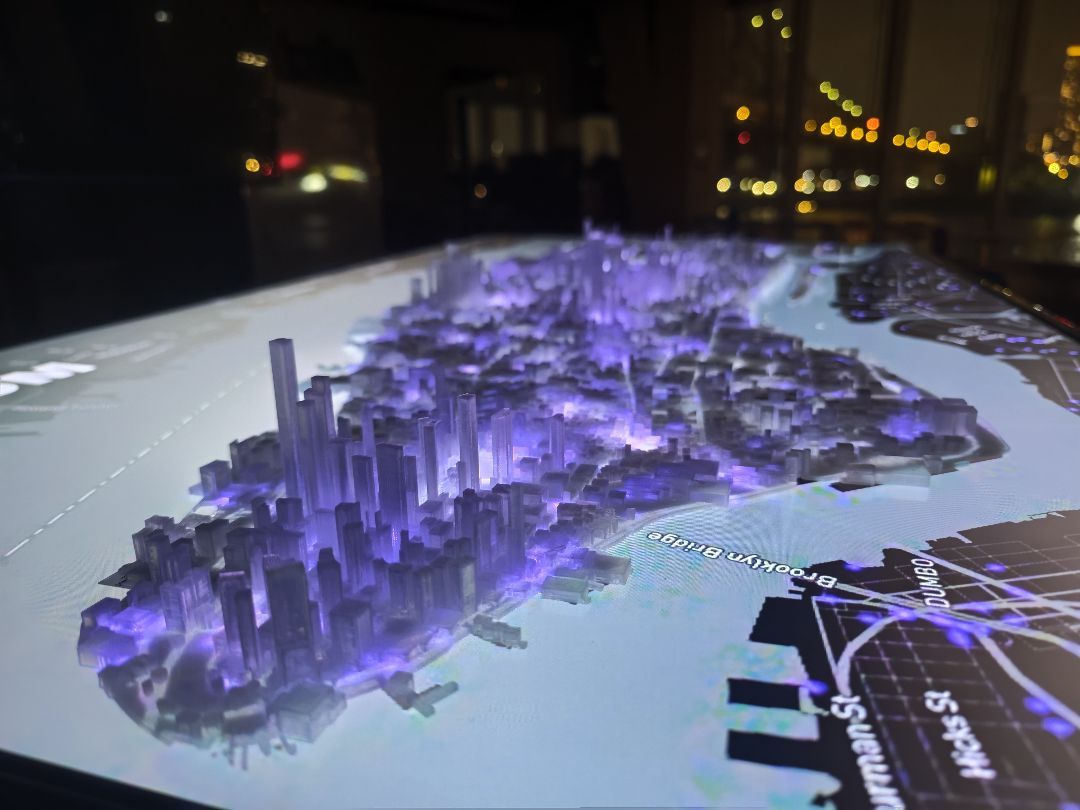
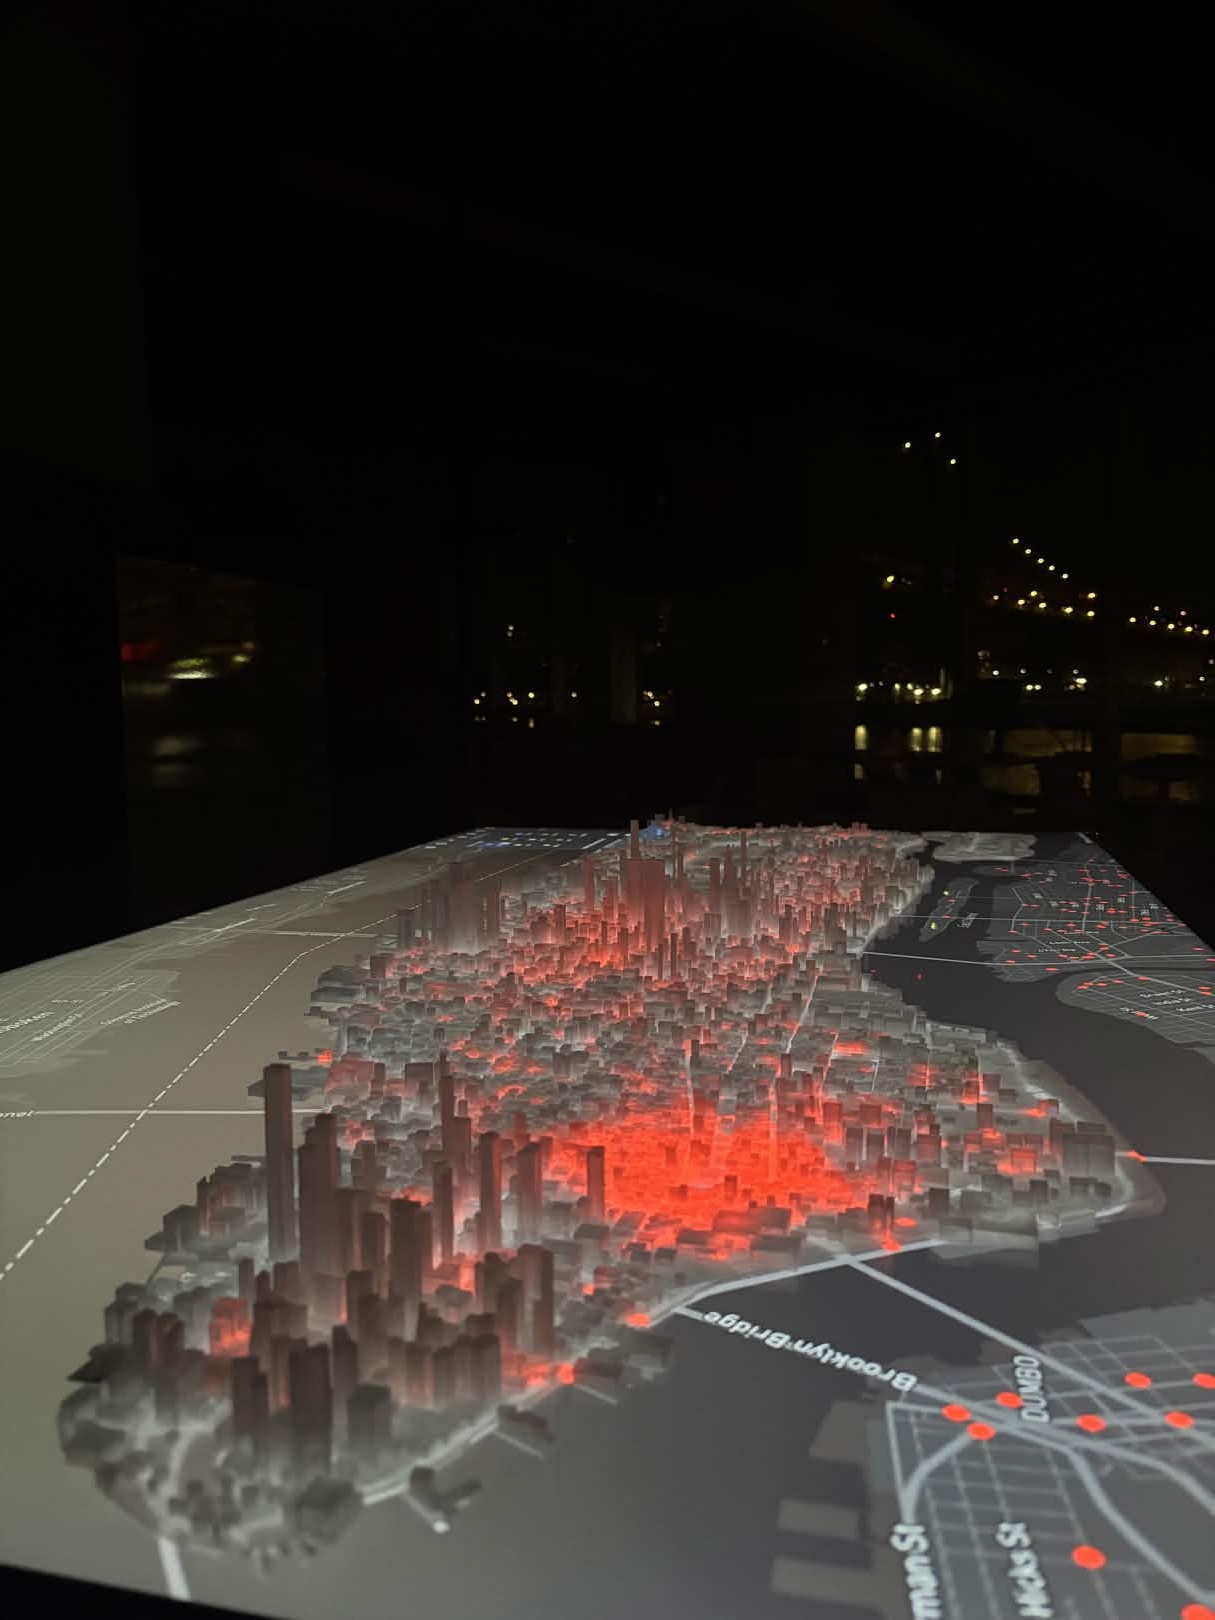
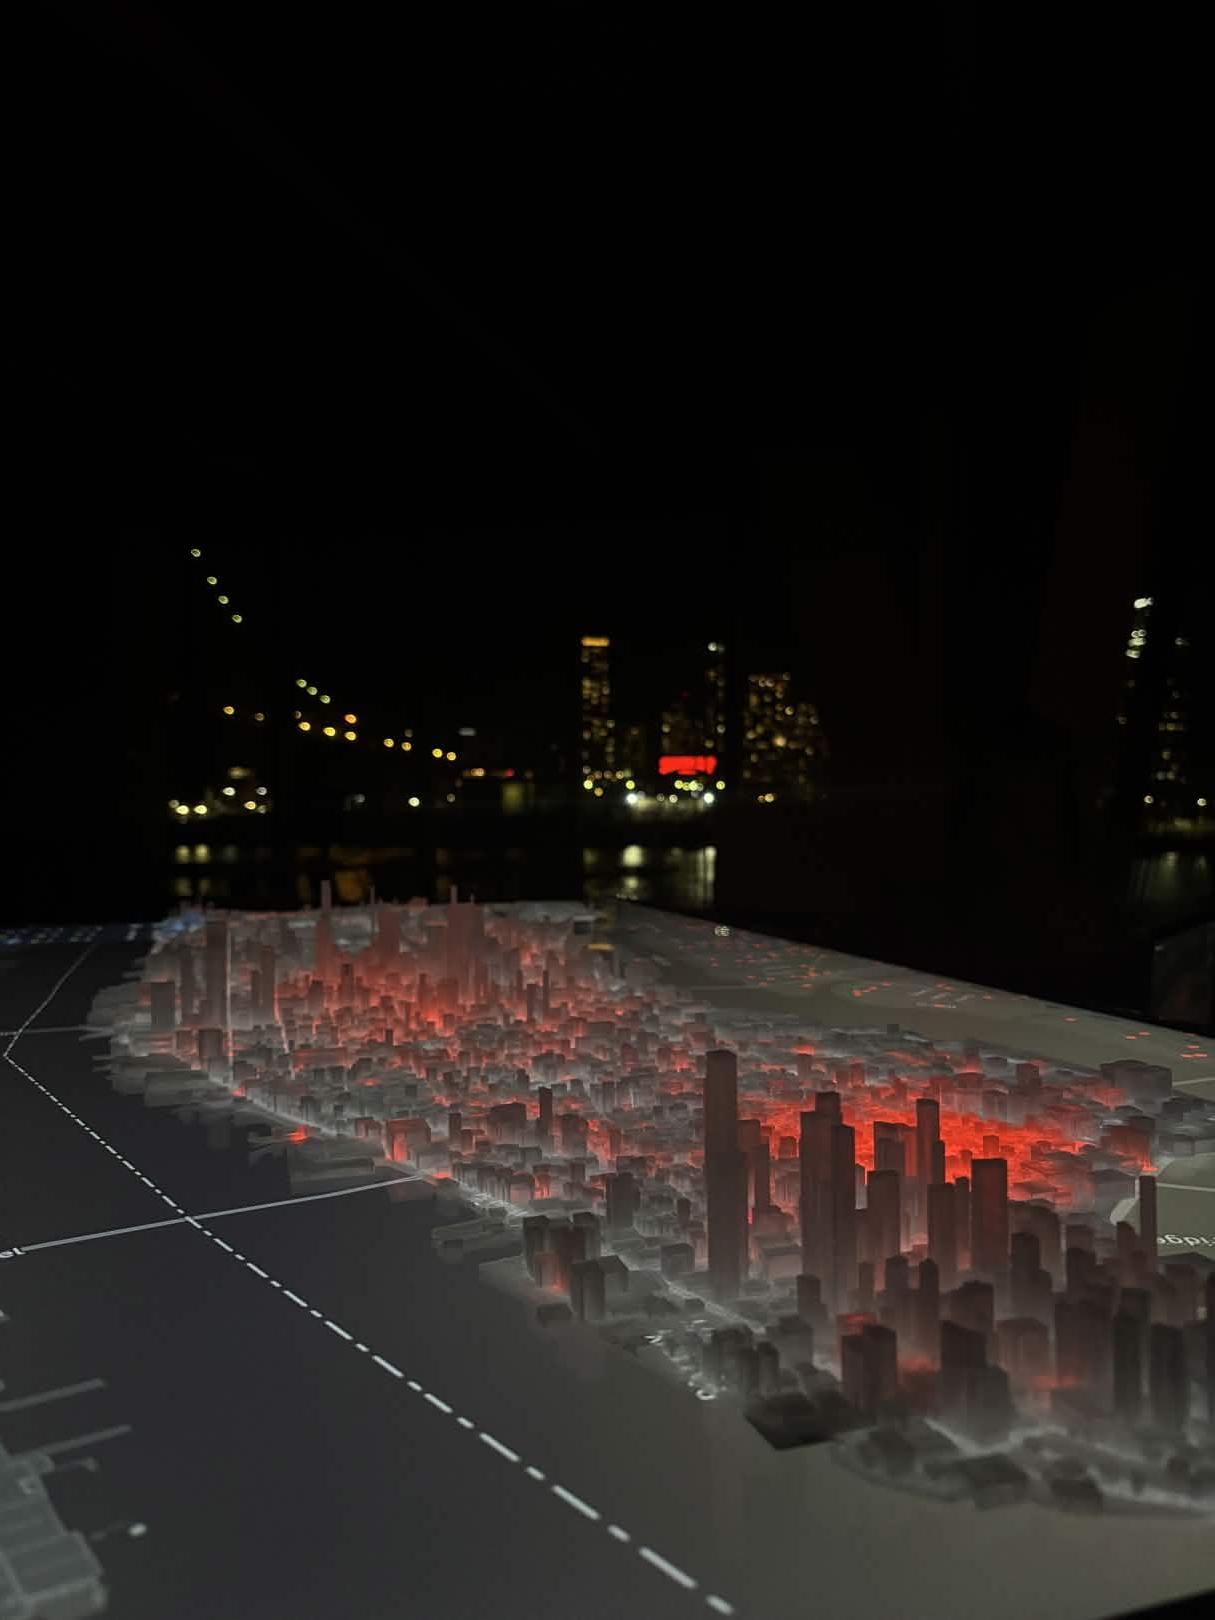
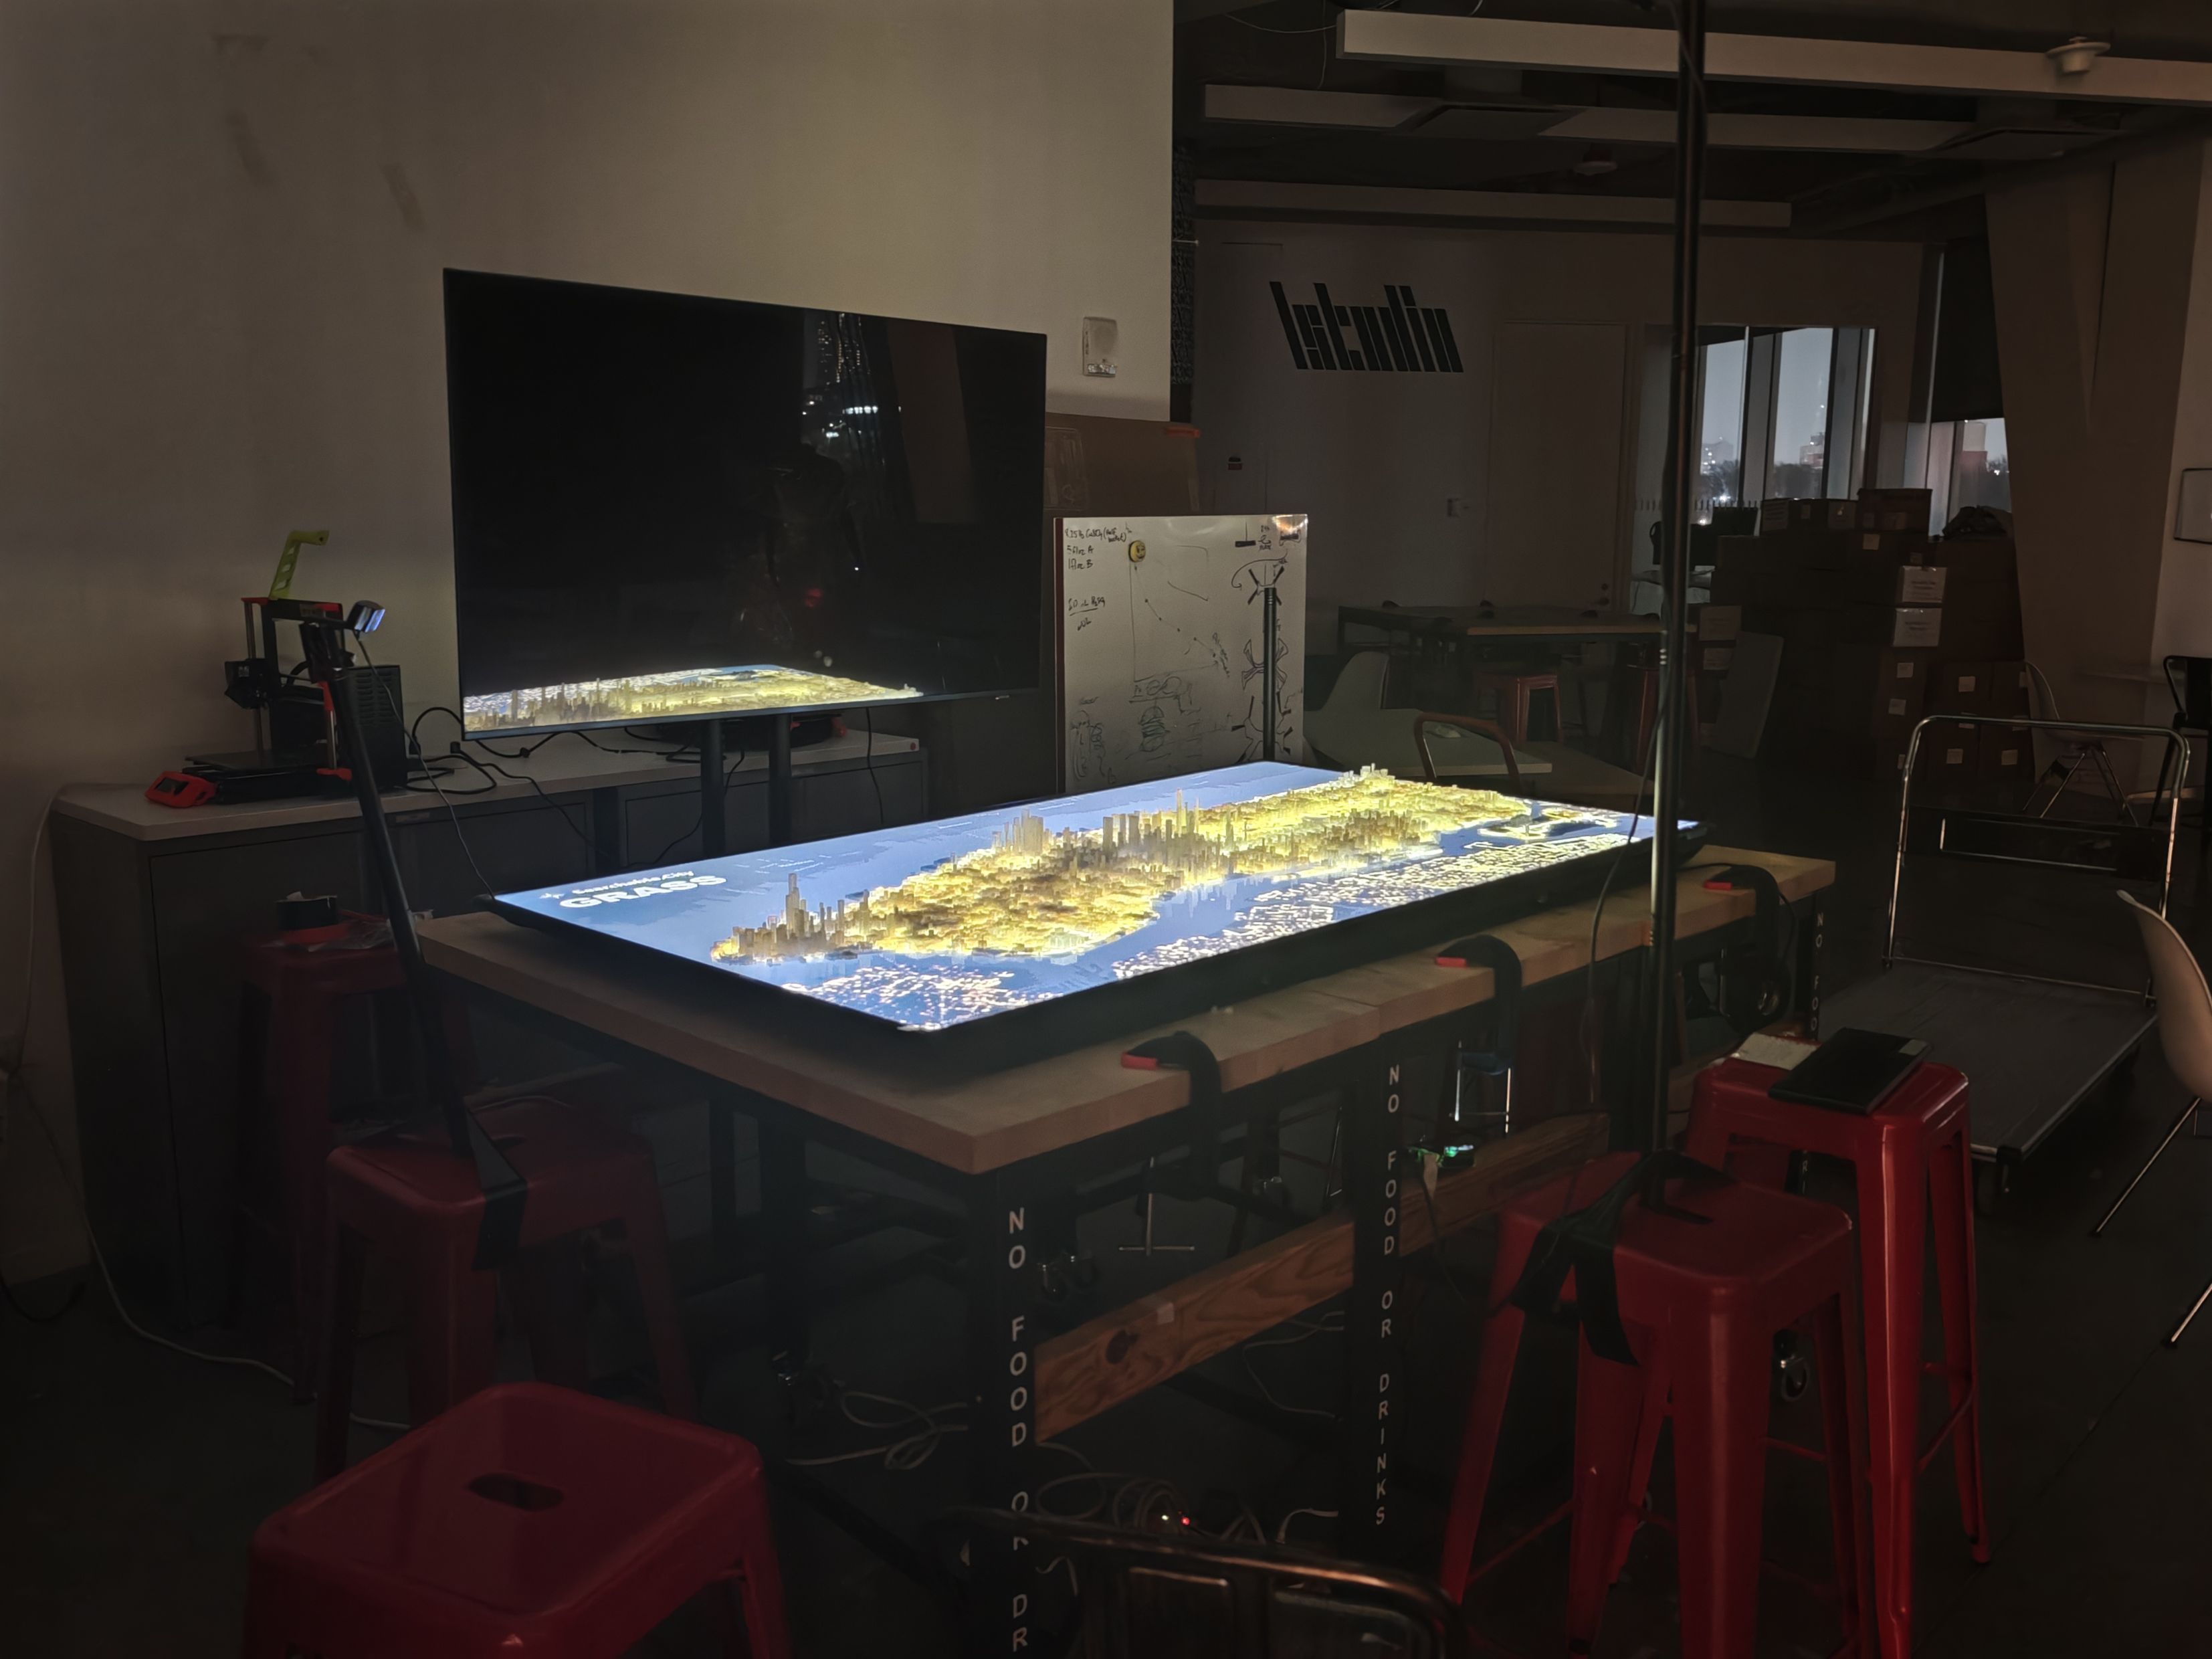
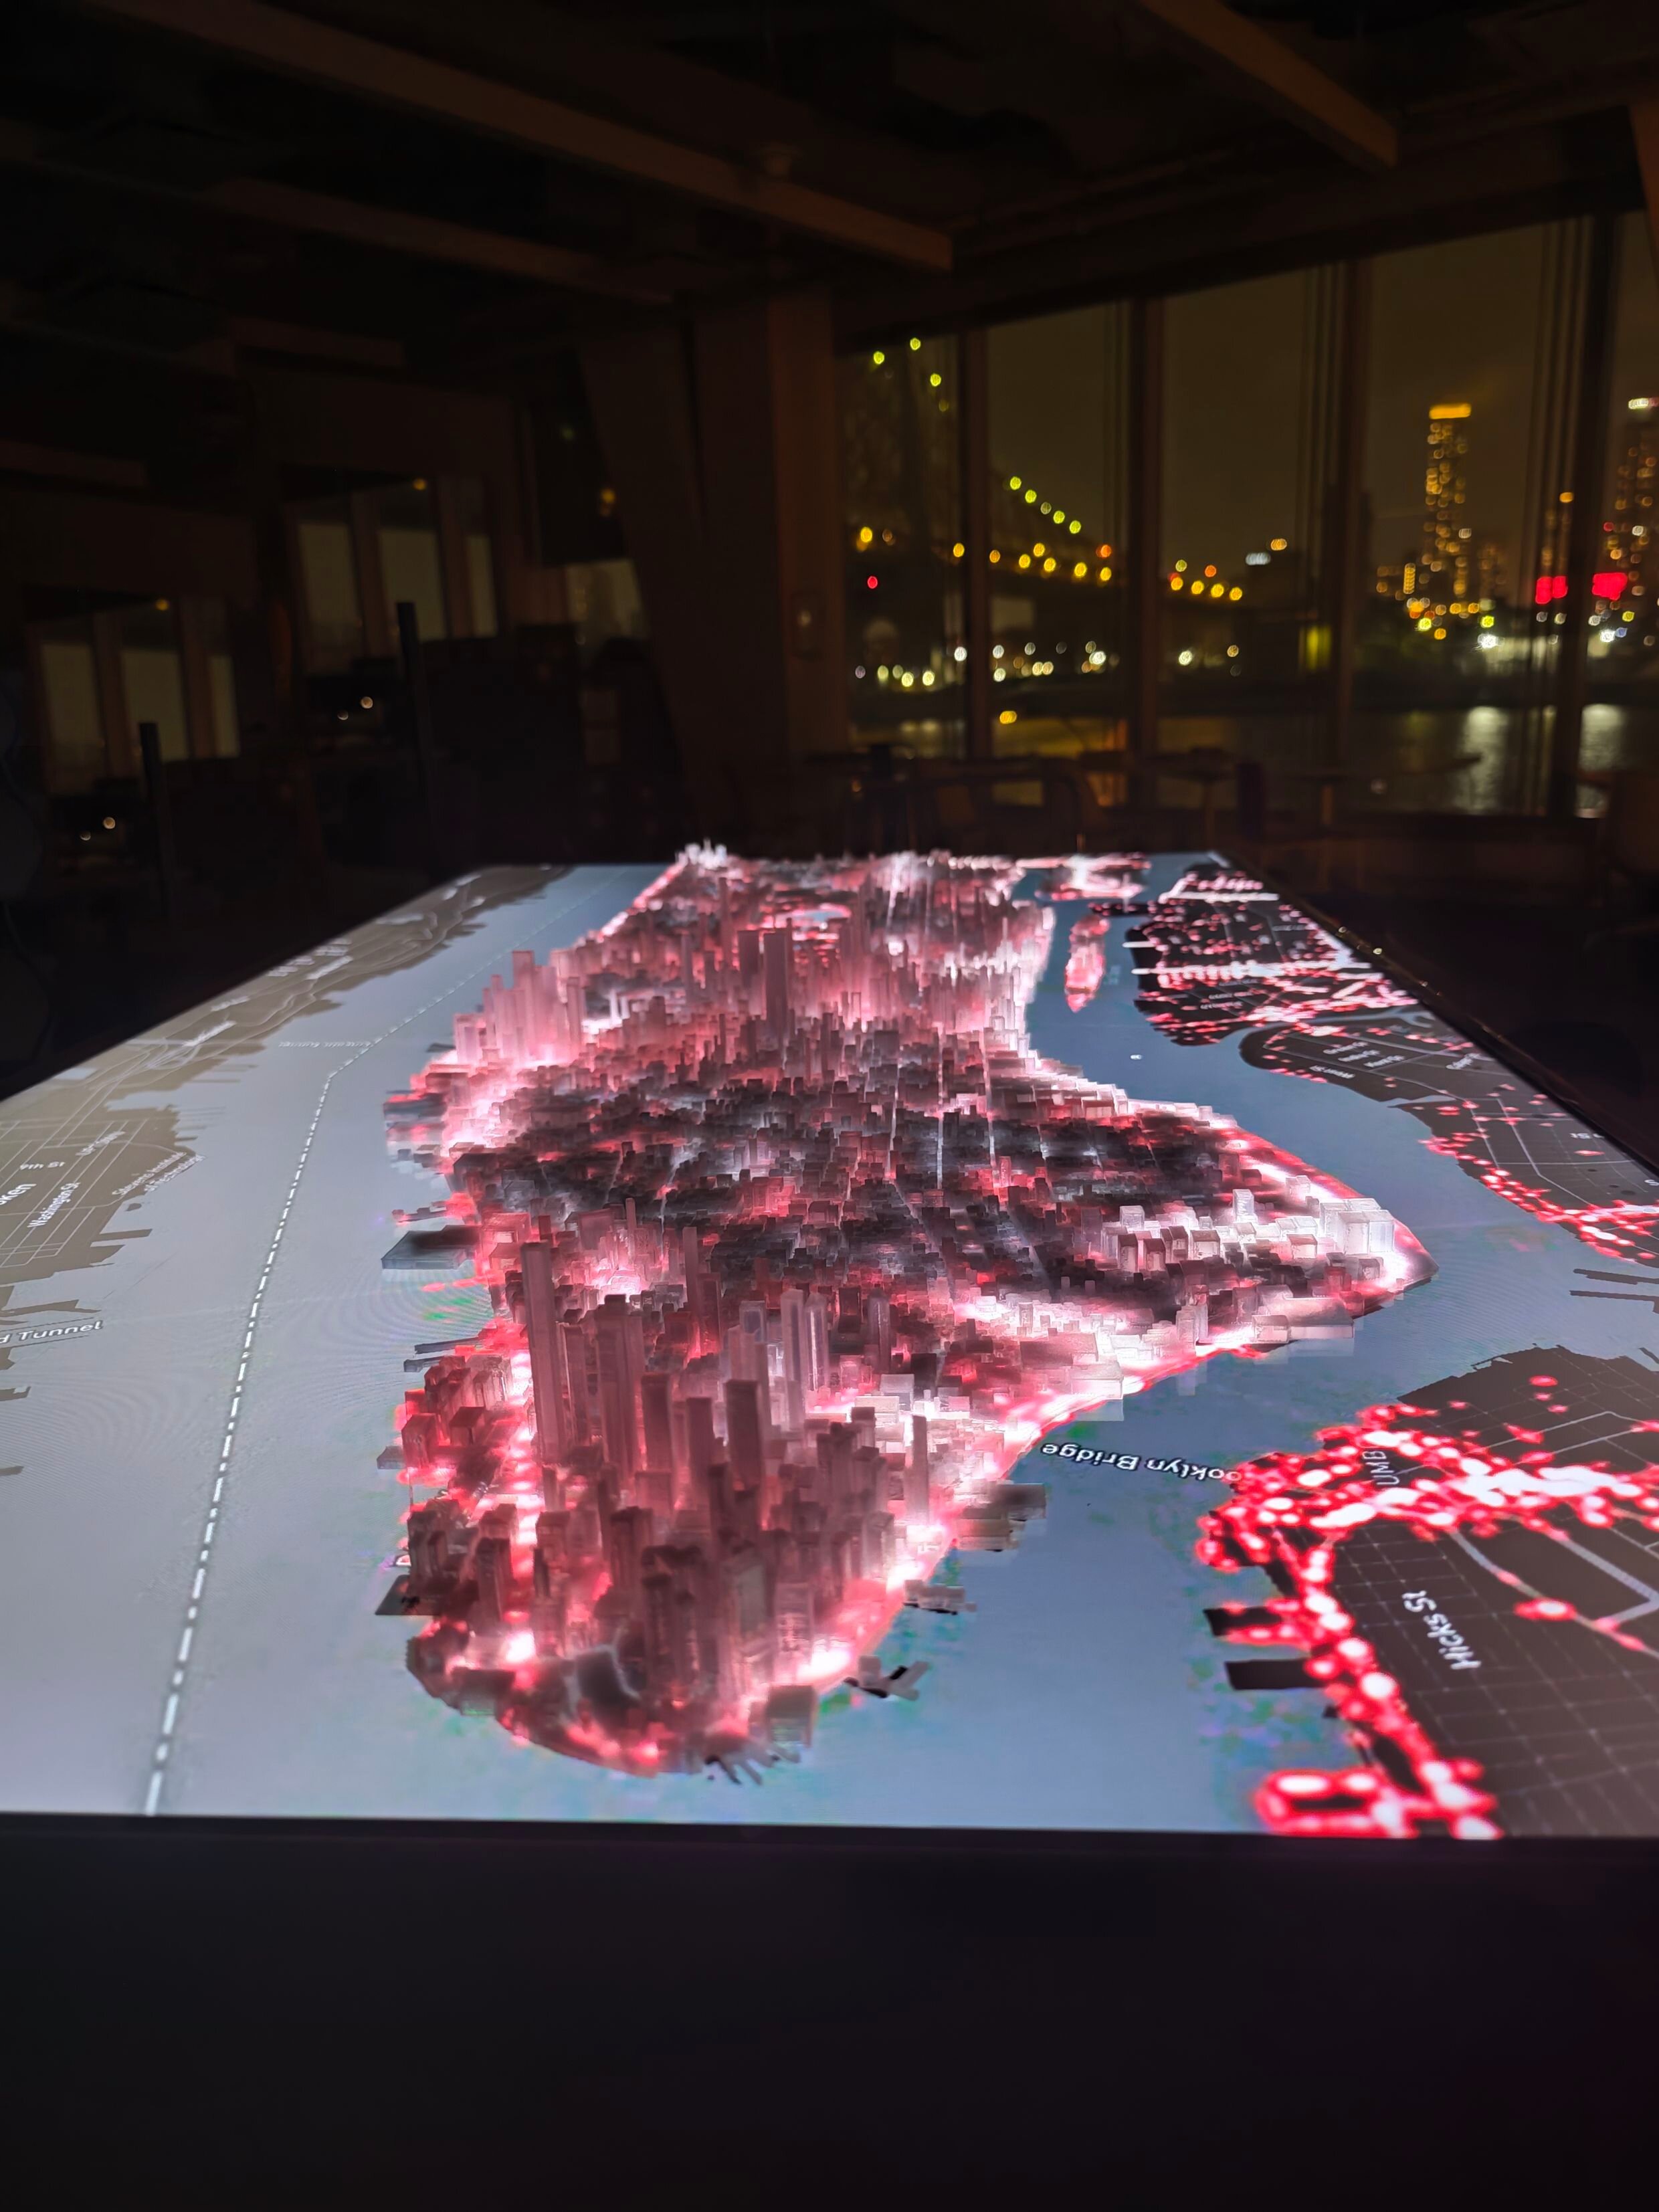
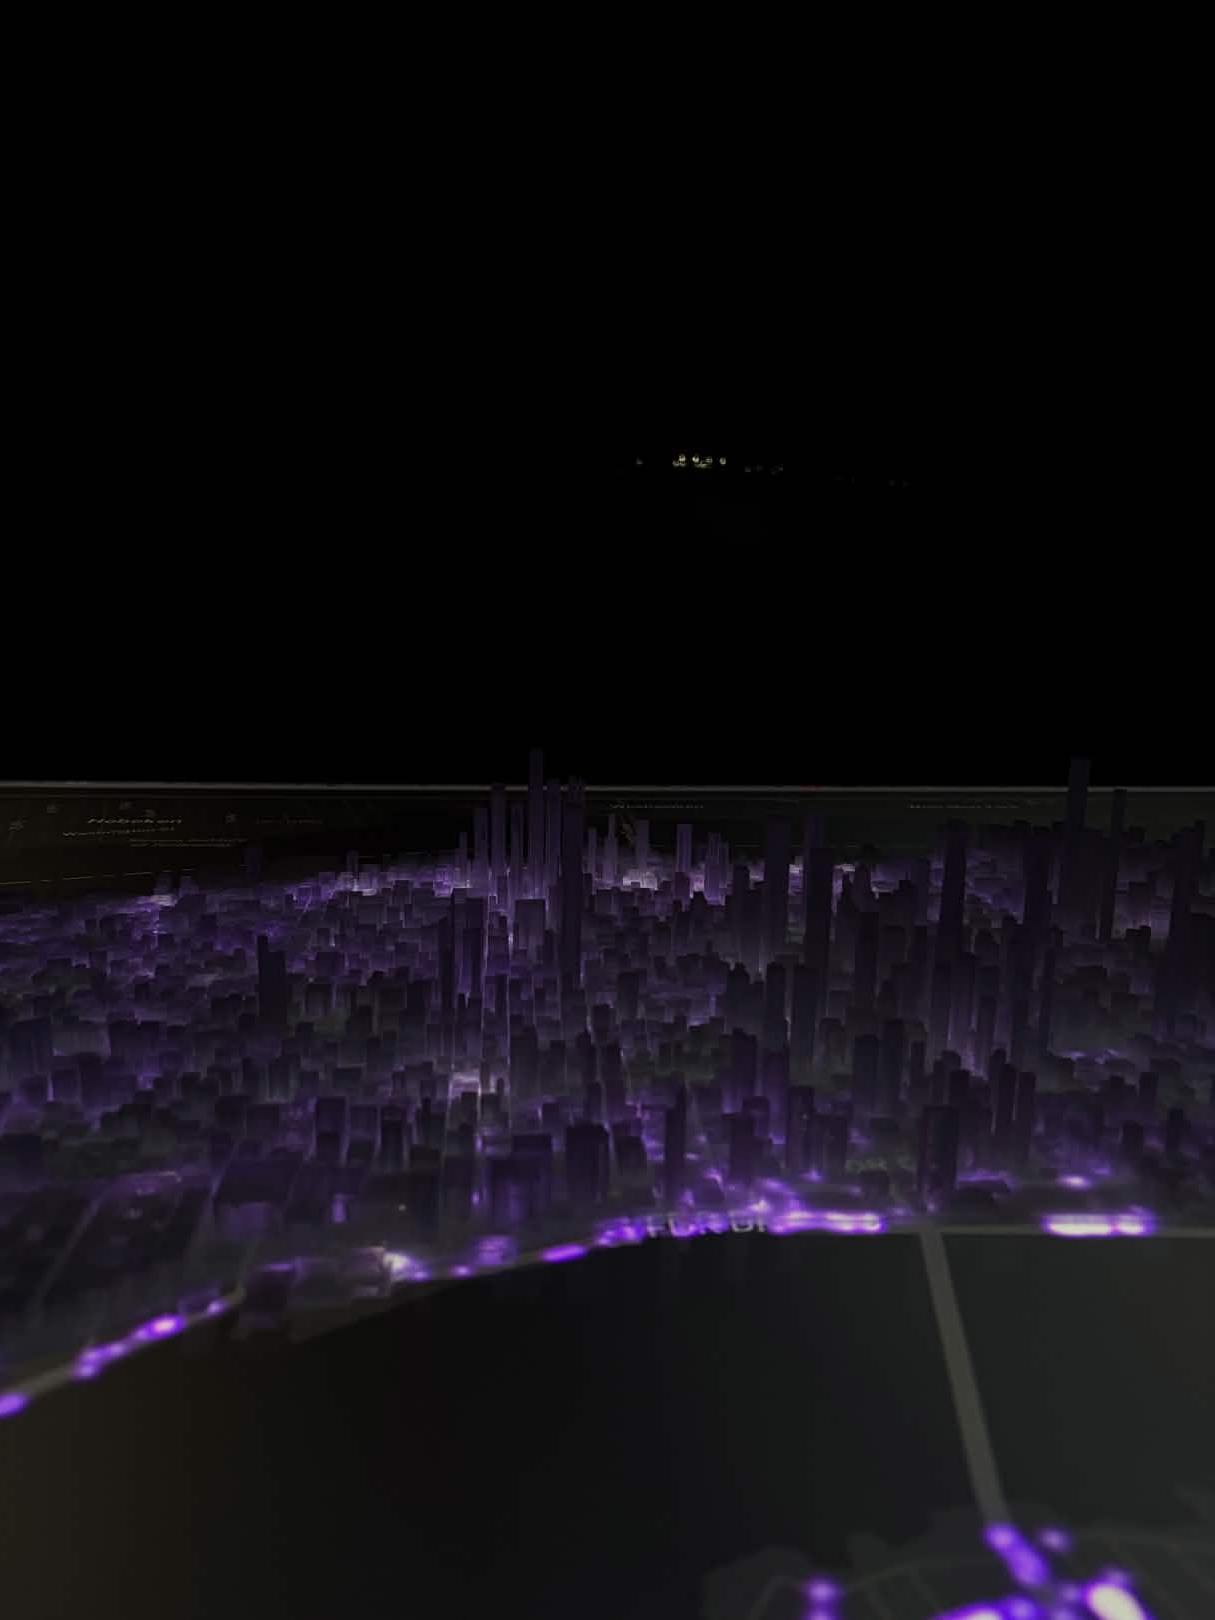
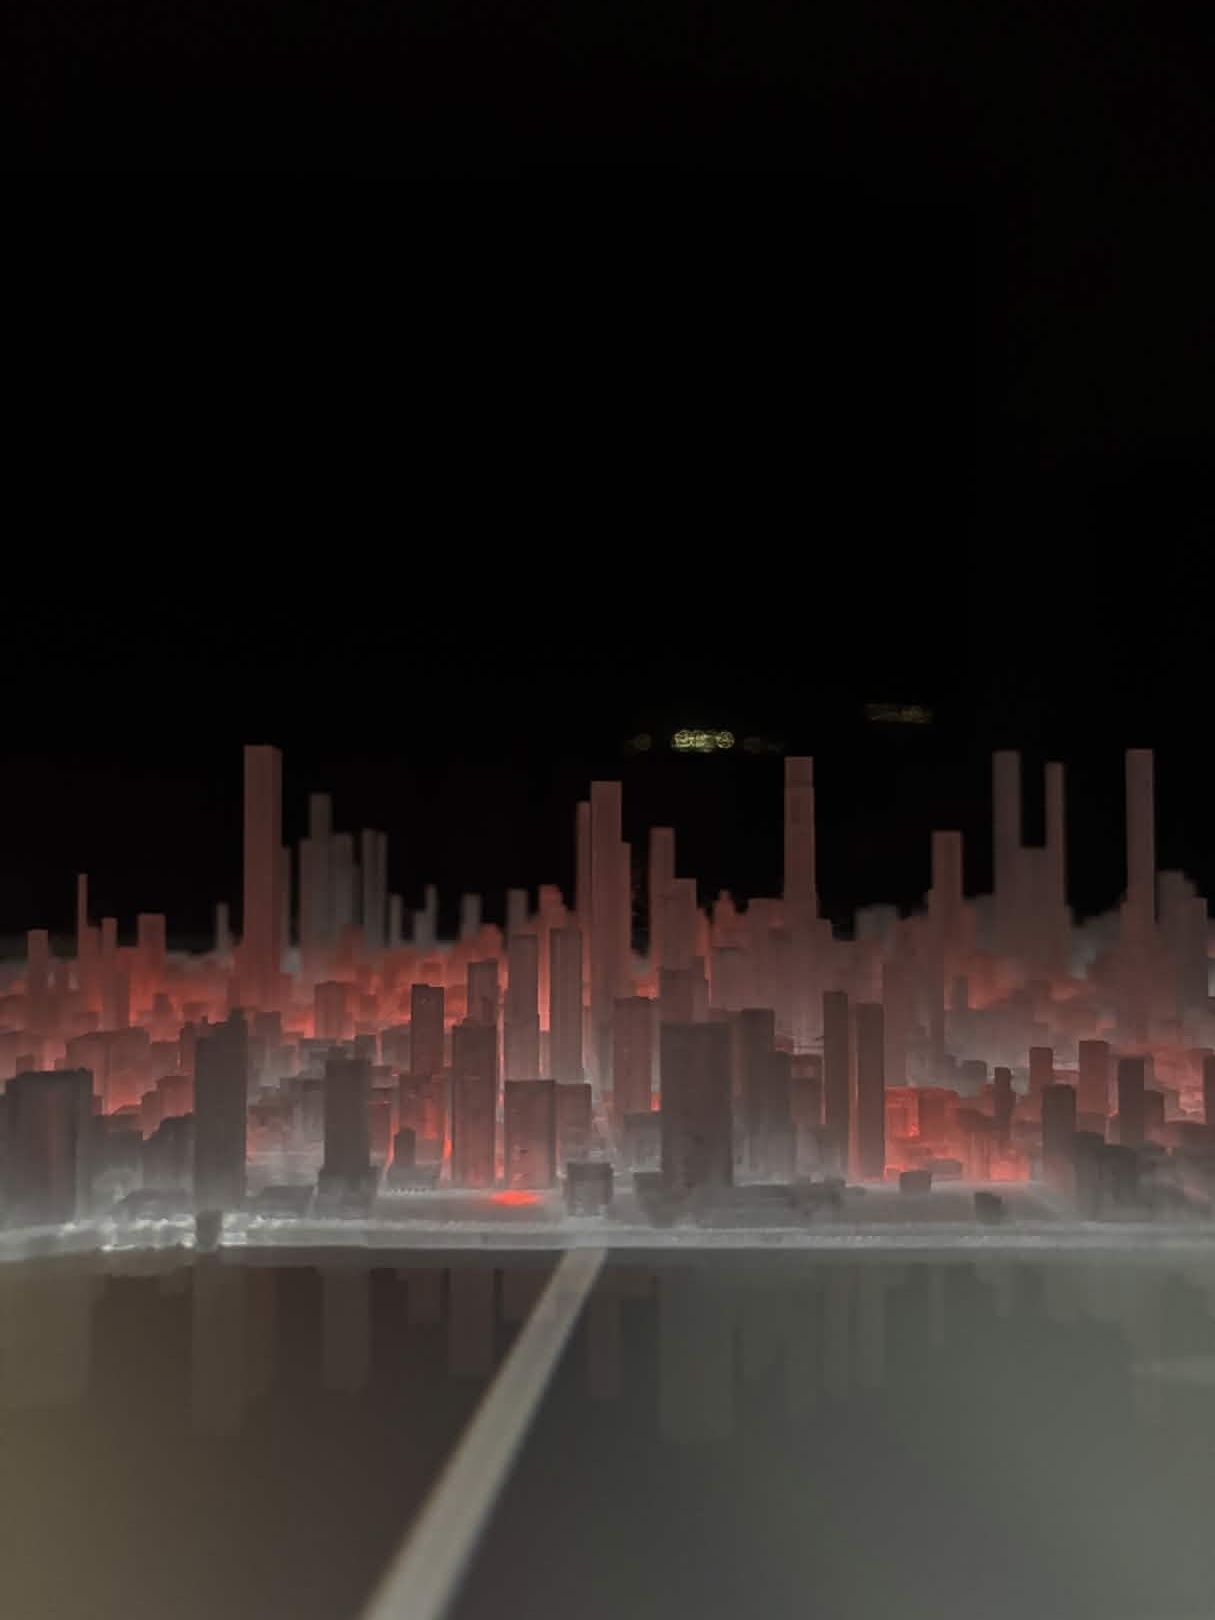
V1 Physical Installation
Below are photos from the first version of the Searchable.City physical installation.
Special Thanks
Imagery from Google Maps. © 2025 Google LLC, used under fair use.
Technologies Used:
Related Projects
AI
Minecraft to 3D
A pipeline that converts any Minecraft world into a high-quality polygonal scene for major 3D engines. Presented at SIGGRAPH 2025.


Data
OpenCityCorpus
A large‑scale urban data corpus (~200 GB) harmonized from over 200 cities to provide a unified repository for AI and urban research.


Data
SmartCityData
A platform for accessing and visualizing smart city data in real-time, helping urban planners make informed decisions.